 Live Manual
Insights
Read campaign performance and visitor journeys
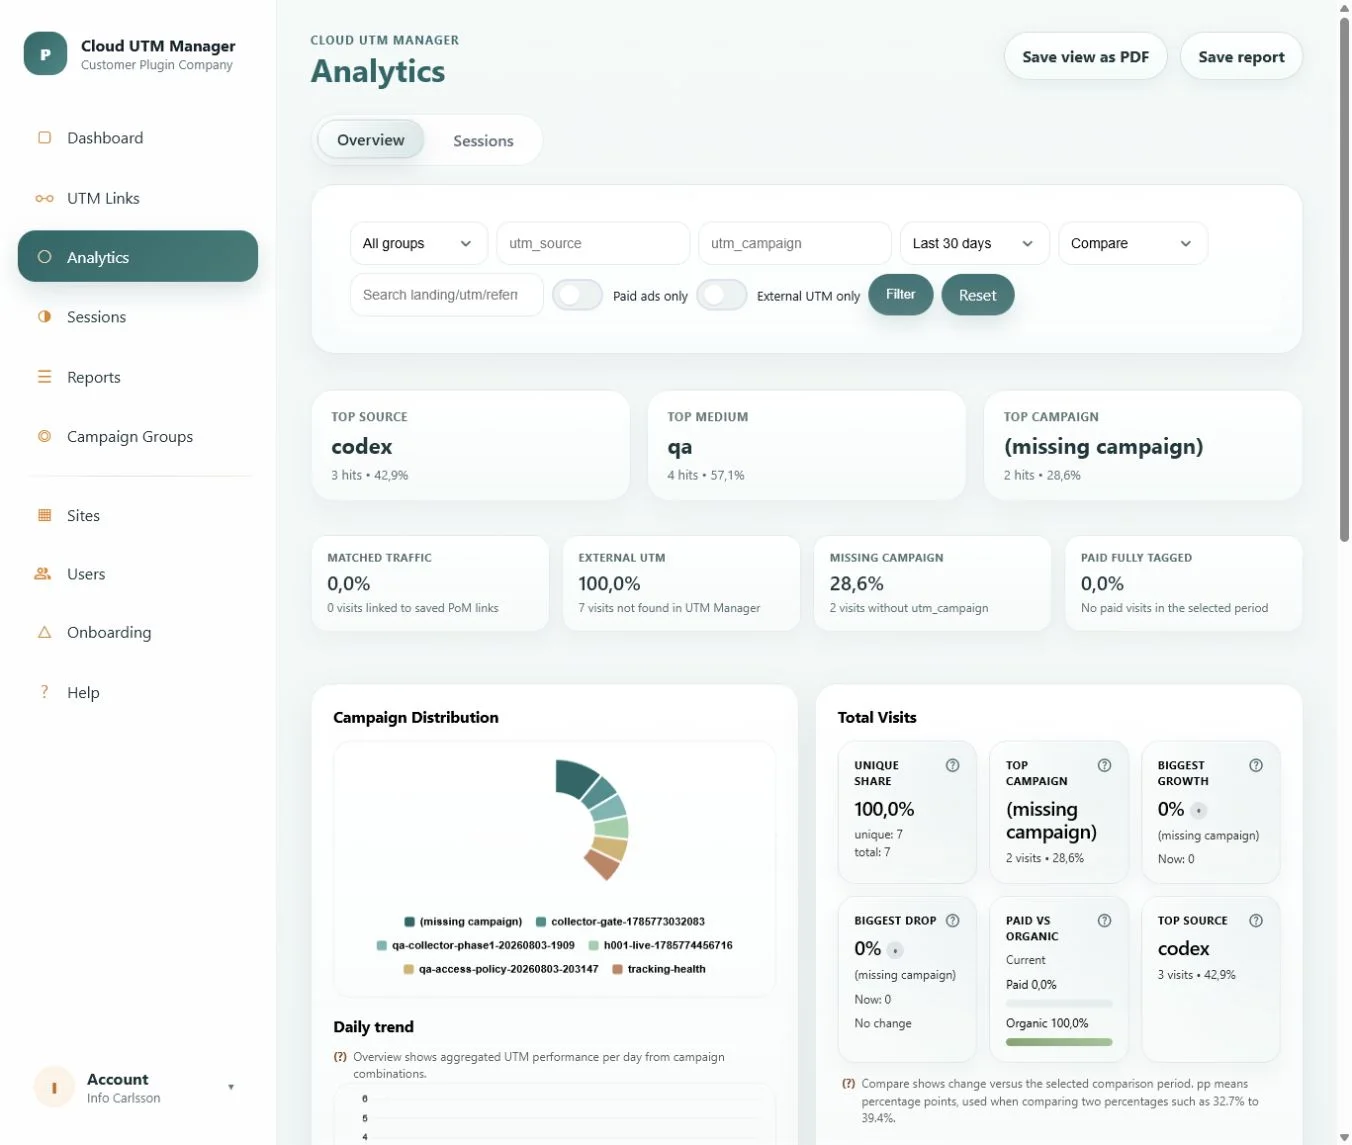
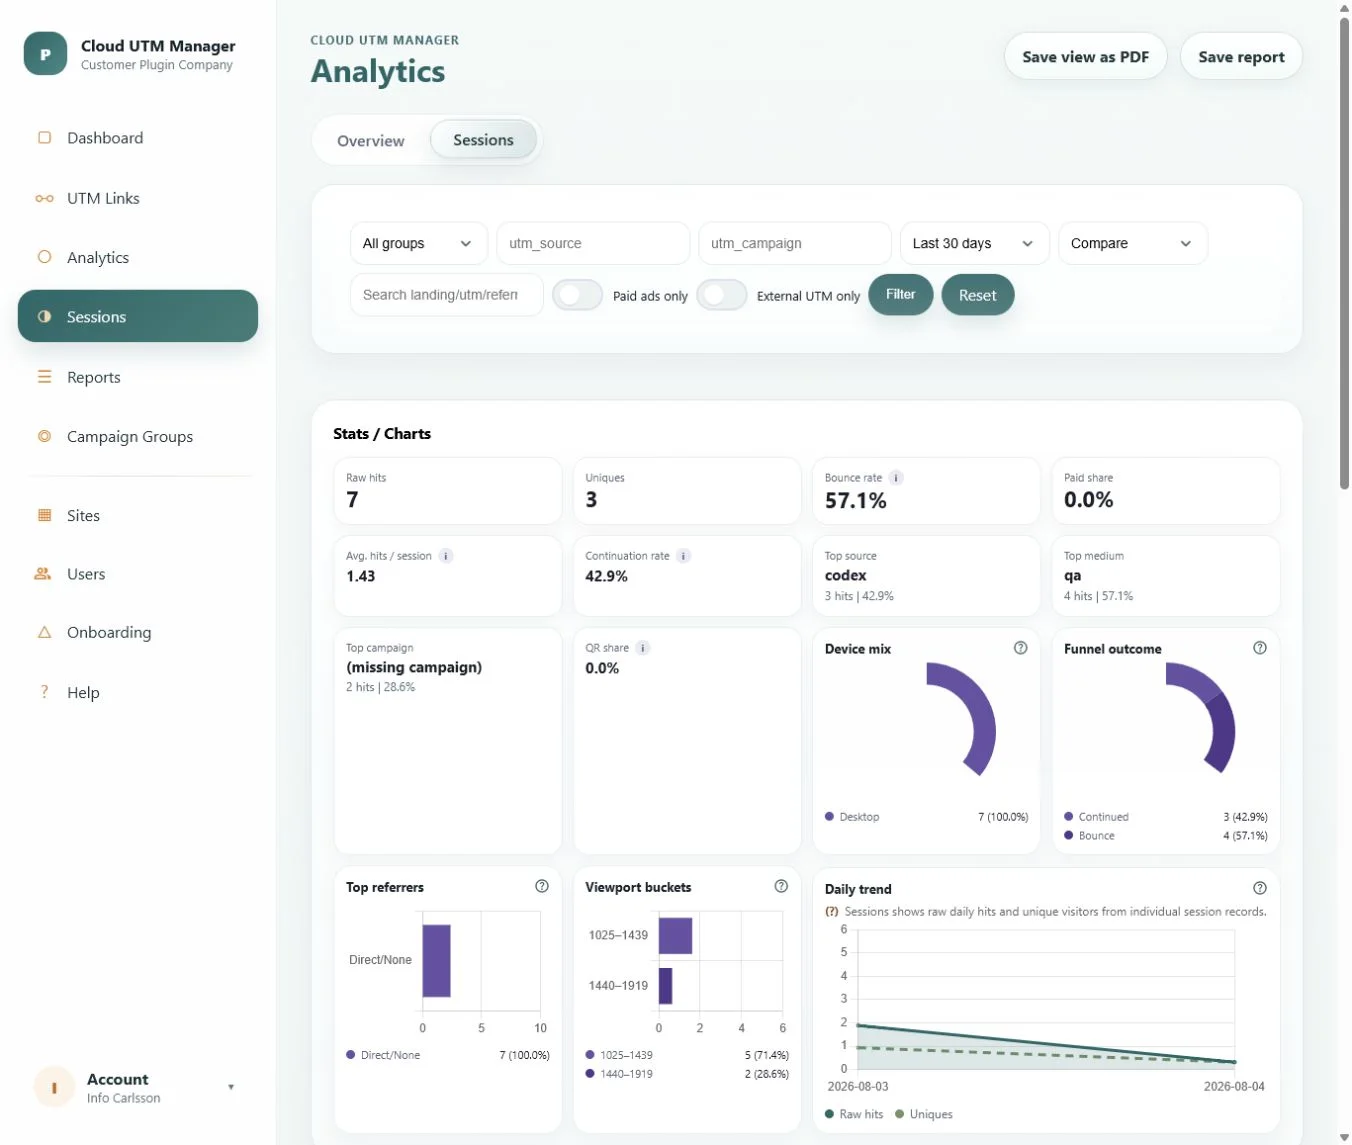
Analytics summarizes campaign combinations. Sessions starts from individual visits and shows how traffic behaves after the landing page.
Compare campaigns
Use aggregated hits, unique visitors, campaign distribution, daily trends and period comparisons.
Inspect behavior
Use raw hits, bounce and continuation rates, devices, referrers, viewport sizes and session steps.
Analytics overview
Start with the top source, medium and campaign. Then review tracking-quality cards, campaign distribution, total visits and the daily trend. Use a comparison period when you need to understand change rather than only the current total.
Sessions
Sessions provides the behavioral layer behind the totals. The view includes raw hits, unique visitors, bounce rate, average hits per session, continuation rate, top dimensions, QR share, device mix, funnel outcome, referrers and viewport buckets.
Filter before drawing conclusions
Both views can be filtered by campaign group, source, campaign, time period and search text. You can also isolate paid ads or external UTM traffic. Reset filters before starting a new question so an older selection does not affect the result.
- Select a fixed period or a custom date range.
- Add only the source, campaign or group needed for the question.
- Use Compare in Overview when a previous period is relevant.
- Save the filtered view as a report or export it as PDF when the result should be reused.
Understand matched and external UTM traffic
Matched traffic
The incoming UTM combination matches a link saved in UTM Manager Cloud. This gives the cleanest connection to groups and internal labels.
External UTM
The visit contains UTM values but does not match a saved link. Use this signal to find links created outside your shared naming structure.
Missing campaign and paid fully tagged indicators reveal where the tagging structure needs attention. Fix the source process, not only the report.