
REPORTING THAT DRIVES ACTION
UTM reporting your team can act on with confidence
Turn clean campaign data into a shared understanding of what worked, why it mattered and where to invest next. UTM reporting should make decisions feel clearer—not add another dashboard to maintain.
- Comparable campaign dimensions
- Visitor journey context
- Reports tied to real decisions
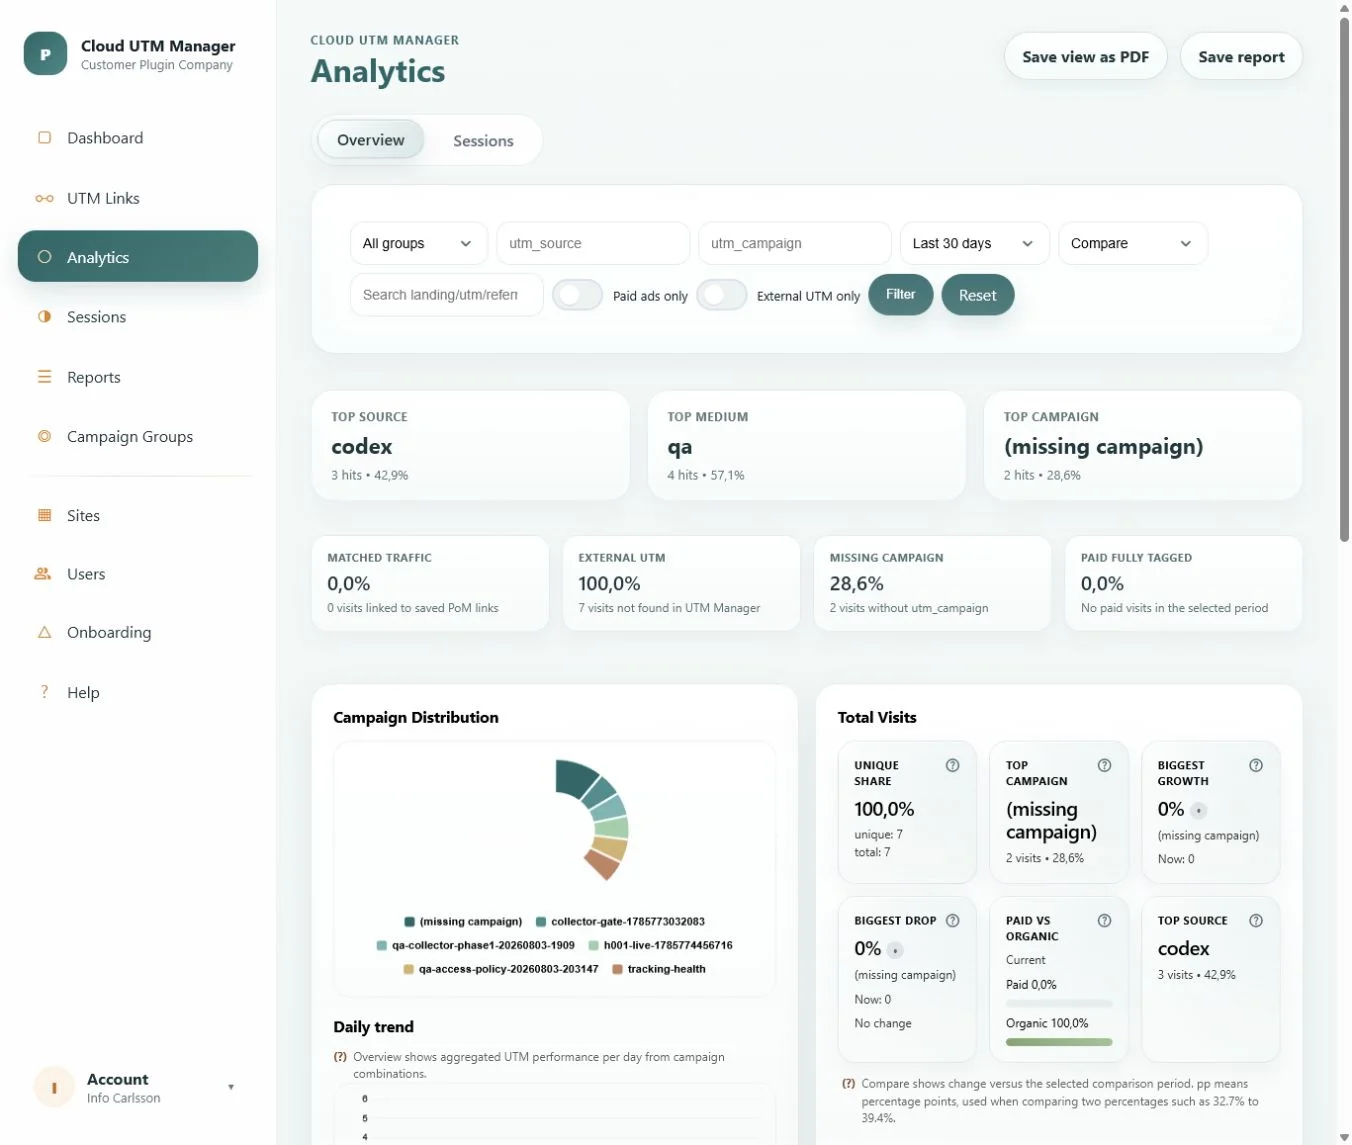
Data you can trust
Consistent values create a dependable foundation.
One shared view
Help teams discuss campaigns using the same story.
The story after the click
Understand which journeys continue toward meaningful action.
Clear next steps
Leave every review knowing what to scale, test or improve.
FROM DATA TO DIRECTION
Turn campaign data into direction, not another dashboard
A list of campaign rows is not a strategy. Useful UTM reporting connects acquisition, visitor behavior and business goals, then helps the team agree on what should happen next.
COMPARE
Compare with confidence
Use stable source, medium and campaign definitions so comparisons feel fair and dependable.
EXPLAIN
Explain what really happened
Look beyond the landing page to understand which campaign visits keep moving toward important content and outcomes.
ACT
Leave every review with a next step
Decide whether to scale, stop, test, fix or investigate. A report earns its place when it helps the work move forward.
A DECISION-READY VIEW
Six dimensions that turn UTM reporting into a useful story
SOURCE
Platform or publisher
Shows which search engine, social platform, newsletter, partner or offline source introduced the visitor.
MEDIUM
Channel type
Groups traffic into comparable marketing channels such as cpc, paid social, email, referral or QR.
CAMPAIGN
Initiative performance
Connects visits and outcomes to the promotion, launch, event or always-on activity responsible for the traffic.
CONTENT
Creative and placement
Explains which ad, button, message or physical placement earned the click when meaningful variants exist.
PAGE
Destination quality
Compares the landing pages and content paths used by campaigns to identify mismatch, friction or stronger entry points.
JOURNEY
Post-click behavior
Adds the pages, actions and outcomes that follow arrival so campaign traffic can be evaluated beyond the first session metric.
REPORTING QUESTION
Which creative attracts visitors who continue toward the goal?
Filter: spring_launch_2026
Compare: utm_content variants
Segment: source and medium
Follow: landing page → product page → demo request
Decision: scale the message that produces qualified journeys, not only clicks.
Reporting habits that protect quality
- Use one source of truth for approved dimensions
- Separate acquisition reporting from internal navigation
- Compare equivalent dates and campaign stages
- Include data-quality warnings in the report
- Record the decision and owner after every review
BUILD THE REPORT
A reporting rhythm that moves the work forward
01
Start with the question
Define the decision the report should support, the audience who will use it and the outcome connected to the campaign goal.
02
Select consistent dimensions
Use source, medium, campaign, content and destination fields that have stable definitions and enough data for a fair comparison.
03
Add journey and outcome signals
Connect acquisition data to relevant page paths, engagements and conversions instead of evaluating traffic volume in isolation.
04
Document the action
Write the conclusion, owner and next test beside the report. A reporting cycle is complete only when it changes a plan or confirms a decision.
COMMON QUESTIONS
Questions about UTM reporting
Differences in capitalization, spelling, separators and channel definitions create separate values. A naming convention and controlled link workflow prevent most duplicates before data is collected.
Match the review cadence to campaign length and decision speed. Active paid campaigns may need weekly checks, while longer initiatives benefit from launch, midpoint and final reviews.
UTM parameters identify acquisition context. Combine that context with page and event data to follow what visitors do after arrival and which paths contribute to meaningful outcomes.
KEEP LEARNING
Improve the data behind every report
Campaign Tracking
Design the measurement flow that produces decision-ready campaign data.
Tutorial
Set up the product workflow and start collecting structured campaign data.
CLOSE THE LOOP
Connect reporting requirements to campaign tracking before launch
Ready for UTM reporting that makes the next step clear?
UTM Manager Cloud combines structured links, QR campaigns and visitor journeys so your team can see the story behind every result.